Summerbridge
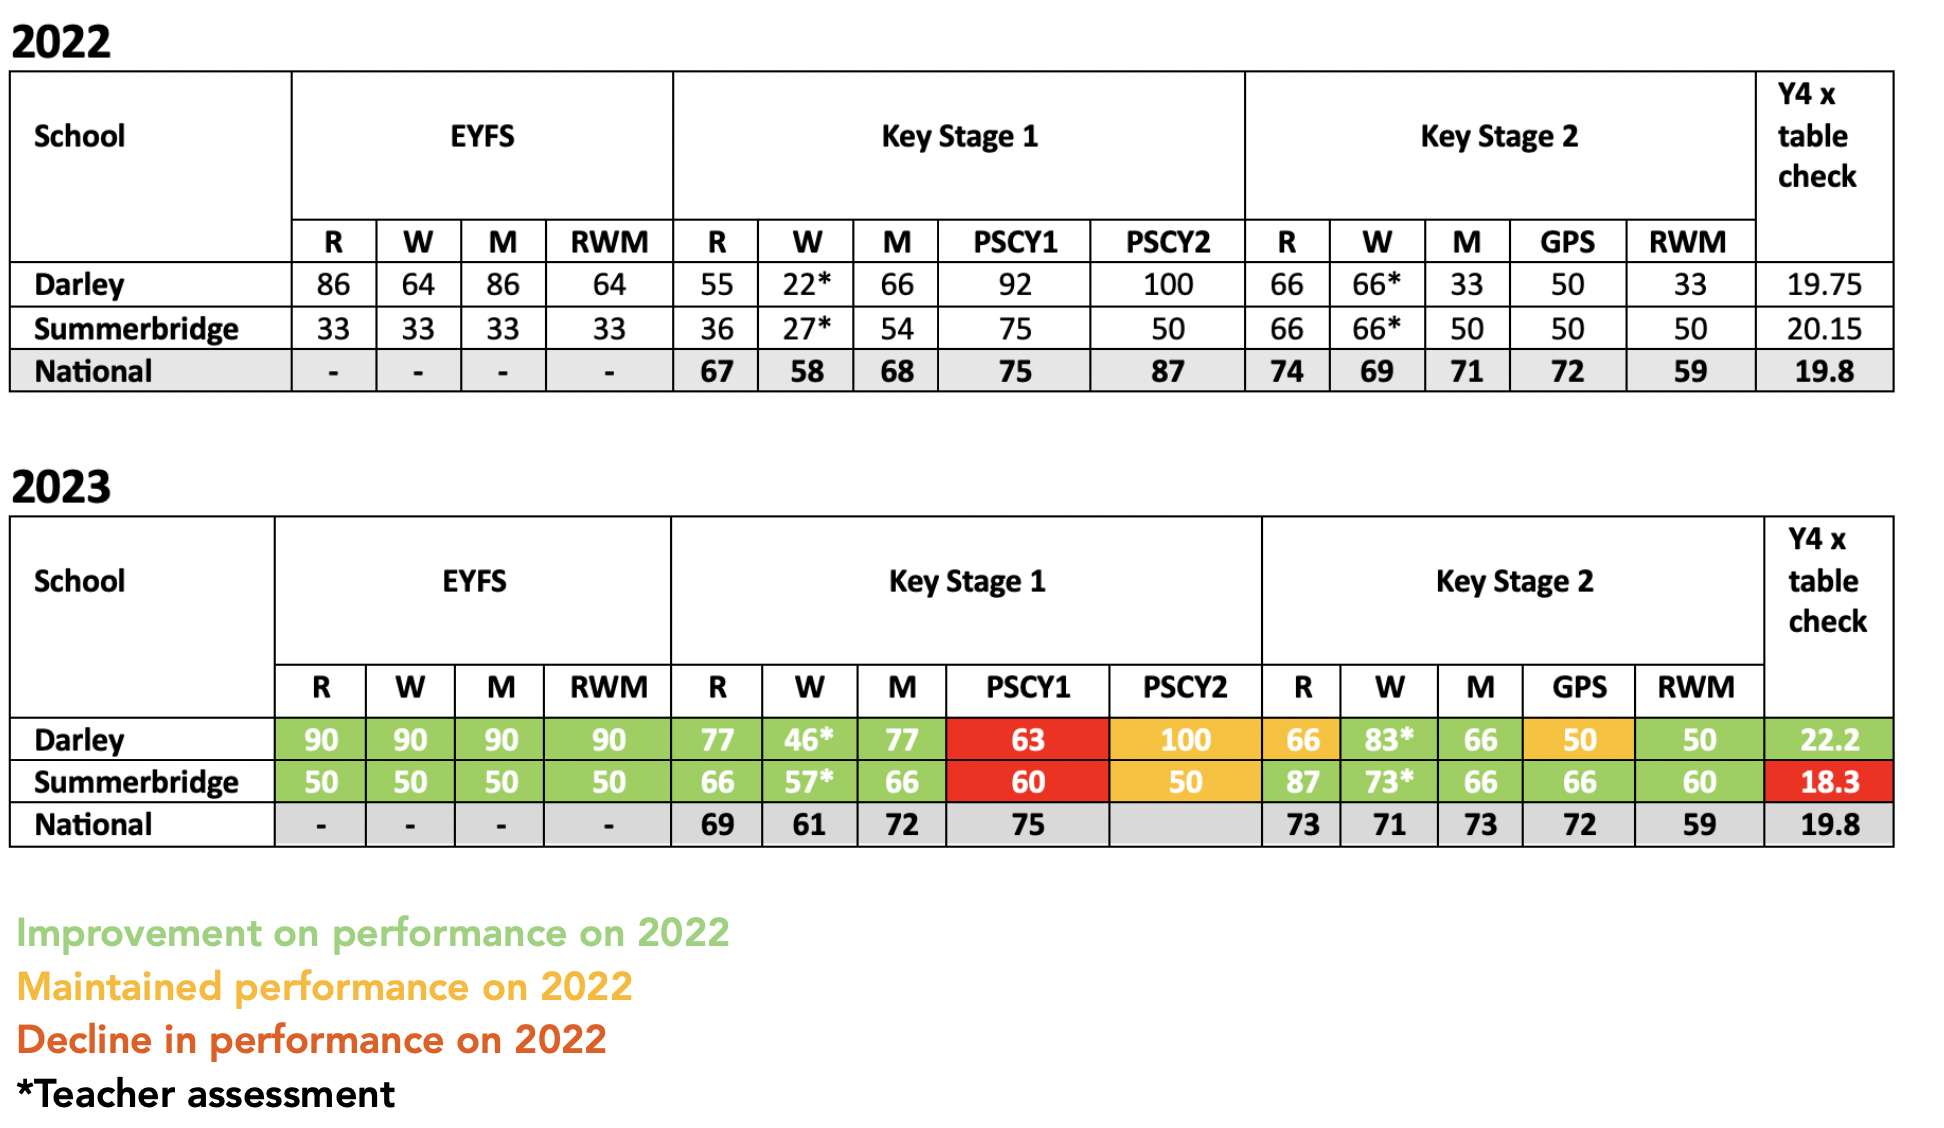
DFE School Performance Tables
School Performance Tables as published by the DFE can be found by following this link:
Progress in reading*
School
Between
-3.7 and 0.9
Between
-3.7 and 0.9
Progress in writing*
School
Between
-3.7 and 0.9
Between
-3.7 and 0.9
Progress in maths*
School
Between
-3.7 and 0.9
Between
-3.7 and 0.9
Percentage of pupils meeting the expected standard in reading, writing and maths
- School SUP%
- Local Authority Average 62%
- England Average 64%
Percentage of pupils achieving at a higher standard in reading, writing and maths
- School SUP%
- Local Authority Average 10%
- England Average 10%
Average score in reading**
School
Local Authority Average
England Average
Average score in maths
School
Local Authority Average
England Average
* The scores are calculated by comparing the key stage 2 test and assessment results of pupils at this school with the results of pupils in schools across England who started with similar assessment results at the end of the previous key stage – key stage 1.
A score above zero means pupils made more progress, on average, than pupils across England who got similar results at the end of key stage 1.
A score below zero means pupils made less progress, on average, than pupils across England who got similar results at the end of key stage 1.
** This score is known as the reading ‘scaled score’. The score is an average for pupils in the school. The expected standard is a score of 100 or more. The higher standard is 110 or more.
*SUPP
Suppressed: in certain circumstances we will suppress an establishment’s data. This is usually when there are 5 or fewer pupils or students covered by the measure (29 for apprenticeships measures). We avoid making these figures public to protect individual privacy. We may also suppress data on a case-by-case basis.